
League of Legend Pro Game Analysis
Published:
Authors: Samuel Lee, Nian-Nian Wang
GitHub Link: https://github.com/samuellee77/league-of-legend-pro-game-analysis
Introduction
The data set we are working with is professional League of Legends match data for 2022. The main question we explore throughout this EDA is what makes a team win a match. We mainly look at two aspects: the team’s side (blue or red) and the champions they have selected and banned. One of the original motivations for this is due to the widely known rumor that the blue side wins more than the red, and teams tend to choose to be on the blue side when they have priority. We want to verify whether the rumor is true and back it up with data. On the other hand, we are also curious how much of an impact the champions being selected or banned have on the outcome of the match.
Our data set is accessed from the website Oracle’s Elixir. The original data consists of 148992 rows. Every 12 rows is data for a single match; 10 of them are player data, and 2 are team data. In our project, we have decided to focus on Tier 1 and split the data into two sets: player data and team data.
The main columns we work with are gameid, url, league, split, playoffs, patch, side, ban1, ban2, ban3, ban4, ban5, pick1, pick2, pick3, pick4, pick5, gamelength, result. Among all, side, ban1, ban2, ban3, ban4, ban5, pick1, pick2, pick3, pick4, pick5, result were mainly used for exploring the factors for the team to win. Most others were used for early exploratory data analysis and data cleaning to understand more about the data set.
The description to the relevant columns are as follows:
gameid: unique game identification numberurl: url to game data else NaNleague: the region/leaguesplit: the split/season the game was inplayoffs: 0 if the game was in regular season; 1 if the game was in playoffspatch: version of gameside: the team’s side, either red or blueban1,ban2,ban3,ban4,ban5: the 5 champions banned by the opposing team, meaning the champions that cannot be usedpick1,pick2,pick3,pick4,pick5: the 5 champions being picked by the teamgamelength: time the game took in secondsresult: 1 if the team won; 0 if the team lost
Data Cleaning and Exploratory Data Analysis
Data Cleaning
For the data cleaning, we first separate the orignal dataset into two: tier1_player and tier1_team, that is separate the first 10 rows (10 players per match) and 2 rows (2 teams per match) for every 12 rows, because we found that the rows in the original dataset belong to two categories of players and teams. If we don’t separate them, there will be many missing by design values.
A snippet of tier1_player:
| gameid | datacompleteness | url | league | year | split | playoffs | date | game | patch | … | ban3 | ban4 | ban5 | pick1 | pick2 | pick3 | pick4 | pick5 | gamelength | result |
|---|---|---|---|---|---|---|---|---|---|---|---|---|---|---|---|---|---|---|---|---|
| 8401-8401_game_1 | partial | https://lpl.qq.com/es/stats.shtml?bmid=8401 | LPL | 2022 | Spring | 0 | 2022-01-10 09:24:26 | 1 | 12.01 | … | Caitlyn | Jayce | Camille | NaN | NaN | NaN | NaN | NaN | 1365 | 1 |
| 8401-8401_game_1 | partial | https://lpl.qq.com/es/stats.shtml?bmid=8401 | LPL | 2022 | Spring | 0 | 2022-01-10 09:24:26 | 1 | 12.01 | … | Caitlyn | Jayce | Camille | NaN | NaN | NaN | NaN | NaN | 1365 | 1 |
| 8401-8401_game_1 | partial | https://lpl.qq.com/es/stats.shtml?bmid=8401 | LPL | 2022 | Spring | 0 | 2022-01-10 09:24:26 | 1 | 12.01 | … | Caitlyn | Jayce | Camille | NaN | NaN | NaN | NaN | NaN | 1365 | 1 |
| 8401-8401_game_1 | partial | https://lpl.qq.com/es/stats.shtml?bmid=8401 | LPL | 2022 | Spring | 0 | 2022-01-10 09:24:26 | 1 | 12.01 | … | Caitlyn | Jayce | Camille | NaN | NaN | NaN | NaN | NaN | 1365 | 1 |
| 8401-8401_game_1 | partial | https://lpl.qq.com/es/stats.shtml?bmid=8401 | LPL | 2022 | Spring | 0 | 2022-01-10 09:24:26 | 1 | 12.01 | … | Caitlyn | Jayce | Camille | NaN | NaN | NaN | NaN | NaN | 1365 | 1 |
A snippet of tier1_team:
| gameid | datacompleteness | url | league | year | split | playoffs | date | game | patch | … | ban3 | ban4 | ban5 | pick1 | pick2 | pick3 | pick4 | pick5 |
|---|---|---|---|---|---|---|---|---|---|---|---|---|---|---|---|---|---|---|
| 8401-8401_game_1 | partial | https://lpl.qq.com/es/stats.shtml?bmid=8401 | LPL | 2022 | Spring | 0 | 2022-01-10 09:24:26 | 1 | 12.01 | … | Caitlyn | Jayce | Camille | Jinx | Jarvan IV | Nautilus | Syndra | Gwen |
| 8401-8401_game_1 | partial | https://lpl.qq.com/es/stats.shtml?bmid=8401 | LPL | 2022 | Spring | 0 | 2022-01-10 09:24:26 | 1 | 12.01 | … | Akali | LeBlanc | Rumble | Xin Zhao | Thresh | Aphelios | Vex | Jax |
| 8401-8401_game_2 | partial | https://lpl.qq.com/es/stats.shtml?bmid=8401 | LPL | 2022 | Spring | 0 | 2022-01-10 10:09:22 | 2 | 12.01 | … | Thresh | Jayce | Camille | Jinx | Xin Zhao | Rakan | Rumble | Corki |
| 8401-8401_game_2 | partial | https://lpl.qq.com/es/stats.shtml?bmid=8401 | LPL | 2022 | Spring | 0 | 2022-01-10 10:09:22 | 2 | 12.01 | … | Jarvan IV | LeBlanc | Akali | Lee Sin | Leona | Ziggs | Gangplank | Twisted Fate |
| 8402-8402_game_1 | partial | https://lpl.qq.com/es/stats.shtml?bmid=8402 | LPL | 2022 | Spring | 0 | 2022-01-10 11:26:11 | 1 | 12.01 | … | Aphelios | Nautilus | Leona | Jinx | Viego | Thresh | Corki | Graves |
Univariate Analysis
Number of Games Played in Each Patch
We can see that there were no games played in tier 1 leagues in 12.07, and there were only few games in 12.06, 12.08, and 12.16. It is because that most league spring playoffs happened in 12.05 and 12.06, so there was no game played in 12.07. The Mid-Seasonal Invitational(MSI) was hold during 12.08, so there was few games in 12.08 in tier 1 leagues, as we do not include the international competitions. Same reason apply to 12.16, most league summer playoffs happened in 12.15 and 12.16, and then the Worlds happened in 12.18.
Distribution of Game Length
For the following plot, we can see that the distribution of game length is skewed to the right, with the median of 31.39 minutes. We converted from seconds to minutes here for easier interpretation.
Bivariate Analysis
Average Game Length in Each Tier 1 League
From the following boxplot and barplot, we can see that there is no significant game length between each league. One interesting fact is that LCK, known for best game strategy in the game with less teamfight, has the longest average game length, while VCS, known for its bloody and frequent teamfights, has the shortest average game length.
Blue / Red Team Win Rate in Each Tier 1 League
From the table and grouped barplot below, we can see that in most leagues (except LCS, LLA, and VCS), the win rate of blue side is higher than the win rate of red side. Especially in PCS, the difference of the win rates between blue and red sides is about 0.20, which is a significant amount that can affect the result of the game.
| league | Blue | Red |
|---|---|---|
| CBLOL | 0.539095 | 0.460905 |
| LCK | 0.507495 | 0.492505 |
| LCO | 0.514151 | 0.485849 |
| LCS | 0.493464 | 0.506536 |
| LEC | 0.534979 | 0.465021 |
| LJL | 0.514019 | 0.485981 |
| LLA | 0.491979 | 0.508021 |
| LPL | 0.549618 | 0.450382 |
| PCS | 0.605166 | 0.394834 |
| VCS | 0.495356 | 0.504644 |
Interesting Aggregates
Number of Games Played in Each Tier 1 League in 2022
From the plot below, we can see that LPL has the most games played in 2022. This is because they had 17 teams with Single Round Robin and BO3(Best of three) in regular seasons. (Source) The second largest is LCK, which had 10 teams with Double Round Robin and BO3 in regular seasons. (Source)
Most Picked Champions in Each Position
We first create a pivot table to count the times of champions picked in the roles.
| champion | Top | Jungle | Mid | Bot | Support |
|---|---|---|---|---|---|
| Aatrox | 224 | 0 | 1 | 0 | 0 |
| Ahri | 0 | 0 | 886 | 0 | 0 |
| Akali | 144 | 0 | 203 | 0 | 0 |
| Akshan | 21 | 0 | 2 | 0 | 0 |
| Alistar | 0 | 0 | 0 | 0 | 270 |
From the plots below, we can see the most played 10 picked champions in each position. A long list of picked champions have minimal meaning, but this pivot table condenses information and can provide information about the popular champions for every position, and potentially the better performing ones.
Assessment of Missingness
NMAR Analysis
NMAR occurs when the probability of data being missing depends on unobserved information. As we focus on data for tier 1, we realize that url column in the dataset is missing for some rows.
| league | Count |
|---|---|
| LPL | 1572 |
| LEC | 84 |
| LCS | 4 |
| LCO | 4 |
| LCK | 2 |
| PCS | 2 |
| league | Count |
|---|---|
| LPL | 1572 |
| LCK | 934 |
| VCS | 646 |
| LCS | 612 |
| PCS | 542 |
| LEC | 486 |
| CBLOL | 486 |
| LJL | 428 |
| LCO | 424 |
| LLA | 374 |
From above, we see how the LPL is not missing any urls, while others teams completely do not have any urls or have some. If LPL consistently provides this URL while other teams vary, it suggests that the missingness is related to the specific teams themselves. This is NMAR because the presence or absence of a URL linking to match information depends on the team; however, it cannot be recovered by other columns.
This indicate differences in how teams handle data reporting regarding match information. It could also reflect differences in resources, priorities, or organizational policies among the teams.
Missingness Dependency
We would like to carry out permutation tests to test if the missingness of ban1 to ban5 columns are dependent to the side column. We chose the test statistic of TVD and the p-value cutoff of 0.05.
From the graph above, we can see that the p-values of the permutation tests for 5 ban columns are much larger than 0.05, which means that the missingness in the ban columns are not dependent on the side of the team.
However, is the missingness of ban1 column related to missingness of ban2, ban3, ban4, and/or ban 5? We can perform another permutation test to answer this question.
Therefore, from the above plots, it is clear that the missingness of ban1 is related to the missingness of other ban columns.
Hypothesis Testing
- Null hypothesis: The win rates of teams on the Blue and Red sides are equal.
- Alternative hypothesis: The win rate of teams on the Blue side is higher than the win rate of teams on the Red side.
- Test statistic: The difference in proportions of win games between the Blue and Red sides.
- Significant Level(p-value cutoff): 0.05
- We will perform permutation test to test the hypothesis.
The observed test statistic is 0.0553. The p-value is 0.0. Since the p-value is less than the significant level (0.05), we reject our null hypothesis. From our test, the win rate of teams on the Blue side is higher than the win rate of teams on the Red side.
Framing a Prediction Problem
Our prediction problem is that we want to predict the result of the game at the end of ban/pick. Therefore, it is a binary classification problem. We use the DecisionTreeClassifer to predict 0 and 1 for the result column. We use precision as our metric because we think that it is important to evaluate the false positive of our model because we don’t want to be misleading about a strategy that will not make the team win.
Baseline Model
In the baseline model, we use pick1 to pick5 columns as features. They are all nominal variable, having the names of the champions, which is string, so we have 5 nominal features in our baseline model. We use customized one hot encoder to solve the problems that some champions may not appear in the train data but can appear in the test data. We use the DecisionTreeClassifier() with the max depth of 5 to predict.
Our train score is 0.5244, and our test score is 0.4771, which are very low, even lower than random chance (p = 0.50). Therefore, we need to include new features and change our feature engineering process.
Final Model
For this part, we are going to include the side column as a new feature to predict the result of the game because we think that side selection can affect the result. As we demonstrated earlier, the win rate of blue side is higher than the win rate of red side.
For feature engineering part, we would like to add the feature of pick rate of each champion because this can provide more information about the strength of individual champions. Therefore, we build another customized one hot transformer that one hot encode the champions and also include the pick rates of them. Like the baseline model, we also use DecisionTreeClassifier().
The train and test scores of our new model now become 0.5564 and 0.5159. We can see that the score improves a little bit. We are going to find the best hyperparameters for our model. After running through different hyperparameters, the best hyperparameters are the max_depth of 4 and the min_samples_split of 8, which has the test score of 0.5545.
The final model has about 0.04 higher score than our baseline mode. Although it is not very high, we believe that those are reasonable because players and teams are more important than the champions they pick and the side they choose.
Fairness Analysis
For conducting fairness analysis, we want to compare whether the model works equally for both blue and red side. As our hypothesis testing concluded that we cannot be sure if their side has an effect on winning, we want to further compare the performances between these two groups.
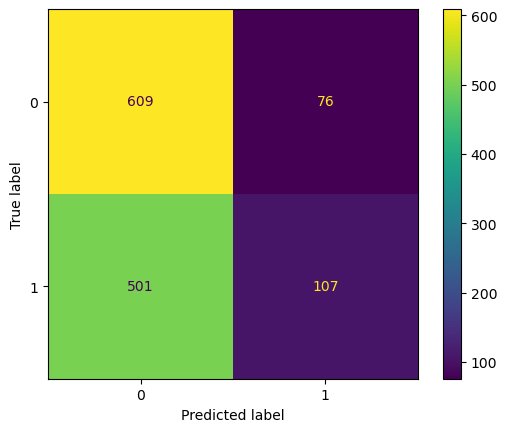
With consideration that teams may consider selecting champions as one important factor to winning a match, cost of false positive of high. It is worse than false negative, where we predict them to lose while they actually won the match during the game. The grid above also shows out of 183 times, 76 teams actually lost when our model predicted them to win. Therefore, we decide to evalue our model’s performance on precision, which is 0.5815.
We run a hypothesis test to check if the difference of our model performance between blue and red sides is statistically significant.
- Null Hypothesis: The precision of the model for teams on the blue side and red side are roughly the same, and any differences are due to random chance.
- Alternative Hypothesis: The precision of the model for teams on the blue side is greather than its precision for teams on the red side.
- Cutoff: 0.05
- We will perform permutation testing to test our hypothesis
After performing the permutation test, our p-values is 0.034, which is smaller than our cutoff. Therefore, we reject our null hypothesis, meaning that blue side having a higher precision than the red side.